Mendel's Experiment and his laws 3
Now in this part we will study :
b. Co-Dominance
# Both the genes of an allelomorphic pair express themselves equally in F1 hybrids.
# Such alleles which are able to express themselves independently even if present together in
hybrids are called Co-Dominant alleles.
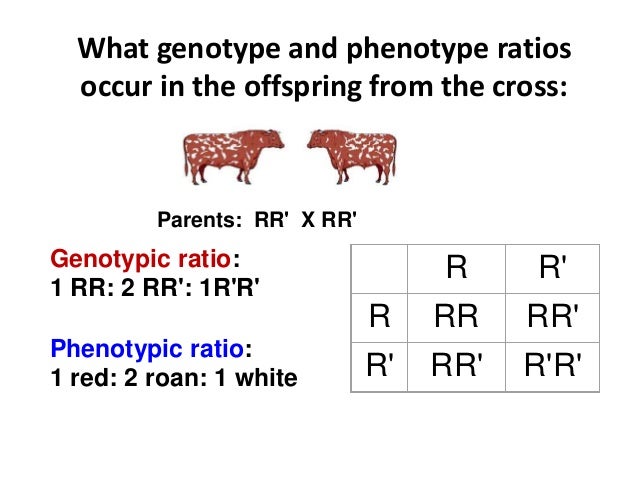
# Example : Coat colour in cattle
# Graphical representation of co-dominance in cattle
In F1 generation all roans are produced.i.e.
RR X R'R' = 4 RR'
In F2 Generation what is observed is as follows-
A. Test cross or back cross
B. Deviations from Mendelian Ratios-
Genetic Interactions
1. Intragenic interactions
a. Incomplete Dominance
b. Co-Dominance
c. Multiple Alleles
2. Intergenic interactions
a. Pleiotropy
b. Polygenes
A. Test cross or back cross
- Test cross is a simple method devised my Mendel to verify or test the F1/F2/F3 Hybrids.
- In test cross F1 hybrid is crossed with the homozygous recessive plant.
- Since the offspring is crossed back with one of the parents, it is also back cross.
- A test cross s a back cross but a back cross is not always a test cross because in test cross we cross the F1 hybrid compulsorily with the recessive parent and in back cross we can choose any one of the two parents.
- The ratio obtained is always 1:1 which is known as the test cross ratio.
- Here is an example of test cross-

B. Deviations from Mendelian Ratios-
After Mendel many scientists performed experiments on different plants and animals and found many exceptions to Mendelian observations. On the basis of these observations various genetic interactions or pattern of inheritance were discovered.This is known as Post-Mendelian genetics or Neo-Mendelian genetics.
Genetic Interactions
They are of two types as follows
1. Intragenic interactions
These occur between alleles of same Gene.We will study three interactions as follows-
They are of two types as follows
1. Intragenic interactions
These occur between alleles of same Gene.We will study three interactions as follows-
a. Incomplete Dominance

# Here both the genes of an allelomorphic pair express themselves partially.
# One gene cannot suppress the effect of other completely.
# There is an intermediate expression in the F1 hybrids.
# Example : In four O' Clock plant(Mirabalis jalapa) and in Snapdragon(Antirrhinum majus)
Incomplete Dominance is observed.
# Graphical representation of Incomplete dominance in Snapdragon-
b. Co-Dominance
# Both the genes of an allelomorphic pair express themselves equally in F1 hybrids.
# Such alleles which are able to express themselves independently even if present together in
hybrids are called Co-Dominant alleles.
# Example : Coat colour in cattle
# Graphical representation of co-dominance in cattle
In F1 generation all roans are produced.i.e.
RR X R'R' = 4 RR'
In F2 Generation what is observed is as follows-
c. Multiple Alleles
# More than two alternative form of gene in a population occupying the same locus on a
chromosome or its homologous are known as Multiple alleles.
# Example : Wings in Drosophila and ABO blood groups in Humans.
# Multiple alleles in Drosophila-
 # Multiple alleles in human blood groups-

# More than two alternative form of gene in a population occupying the same locus on a
chromosome or its homologous are known as Multiple alleles.
# Example : Wings in Drosophila and ABO blood groups in Humans.
# Multiple alleles in Drosophila-
2. Intergenic interactions
These interactions occur between the alleles of different genes on the same or different chromosome
These interactions occur between the alleles of different genes on the same or different chromosome
a. Pleiotropy
# When single gene controls two or more different traits , it is called pleiotropic gene and this
phenomenon is called pleiotropy
# The ratio is 2:1 instead of 3:1.
# The gene causing Sickle cell Anaemia is a pleiotropic gene.
# The graphical representation of the same :

# When single gene controls two or more different traits , it is called pleiotropic gene and this
phenomenon is called pleiotropy
# The ratio is 2:1 instead of 3:1.
# The gene causing Sickle cell Anaemia is a pleiotropic gene.
# The graphical representation of the same :

b. Polygenes
# In Humans some characters like height and skin colour show gradations in expressions.
# These characters are determined by two or more pair of genes and they have either cumulative
or additive effect.
# If there are two genes having additive effect the ratio obtained is 1:4:6:4:1.
Example : Wheat kernel colour
Graphical representation :

# If there are three genes having additive effect the ratio obtained is 1:6:15:20:15:6:1.
Example : Skin colour in humans
Graphical representation :

Thank you , I hope you all understood what are the deviations from the experiments which were performed by Mendel.
For any queries and suggestions please mail me


Comments
Post a Comment